AMOEBA plotter by Iris Gray (right click to download) -
This is a MATLAB implementation for visualizing performance across multiple criteria. Based primarily on: Collie et al (2003) ICES Journal of Marine Science, 60:709-720, and Ten Brink et al. (1991) Marine Pollution Bulletin, 23: 265-270.
Iris developed this to plot the performance of multiple options (e.g. fishery policy choices) in terms of multiple criteria
(i.e. commercial harvest, fish biomass, or other ecosystem services).
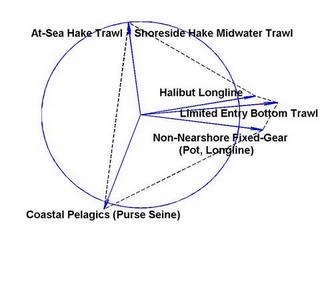
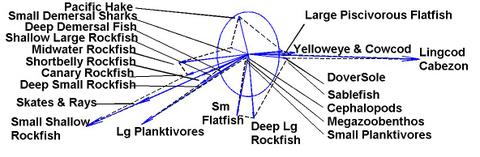
Example: Catch per fleet at the end of the 20 year simulation relative to initial catches. The blue reference circle has a radius of 1.0, so for instance blue arrows that extend 50% beyond the circle represent a 50% increase in catch over the course of the simulation. The angles of the arrows are determined such that the fleets above are aligned with their major target species below.